Dramatic Academic Growth
Quantitative TRC Data
Research has discovered that students who are not reading at grade level by the end of the first grade have a high probability of being a poor reader by the end of the fourth grade (Torgesen, 2004). Most children who are at risk for reading failure can be brought to grade level performance following effective early reading instruction and interventions (Reschly, 2010). If those struggling readers are identified within the first few years of schooling and provided with targeted and concentrated instruction, they are more likely to make the progress necessary to catch up with their peers who are reading at grade level. Teachers must accurately assess student needs, plan, and deliver instruction based on that assessment to meet the unique learning needs of their students. I use mClass reading assessment provided by Amplify to achieve assist with these tasks.
The Amplify mClass online assessment that is used in Kindergarten include Dynamic Indicators of Basic Early Literacy Skills (DIBELS) and Text Reading and Comprehension (TRC) assessments. I complete these assessments one-on-one with each student, and use the assessments to measure various early literacy skills. I monitor the student as they read text-based materials and track student responses on an iPad. The assessments and abilities tested vary depending on the academic calendar. All students are tested in English. Students are tested for the benchmark assessments at the beginning of the year (BOY), middle of the year (MOY), and end of the year (EOY).
Text Reading and Comprehension (TRC), also called mClass Reading 3D, uses leveled texts (PC, RB, A-Z) to determine students' instructional reading levels. Most kindergarten students start on PC which means "print concepts" or RB which mean "reading behaviors". Print concepts measure a student's ability to understand the difference between letters, words, punctuation, and directionality. A student is considered on Reading Behaviors when they can use picture clues and maintain language patterns. Both Print Concepts and Reading Behaviors occur before reading level A, which is the initial level where students can read through a book alone. During the one-on-one assessment, students read text and complete comprehension questions, such as oral comprehension and retelling. I mark and classify the types of errors that students make to better understand the student's oral reading behaviors and reading accuracy.
The test provides me with a student's reading level at the instructional guided reading and independent reading levels. Students' reading levels display as the colors red, yellow, green and blue. Each color indicates where a student is currently performing compared to grade level expectations. Students in red are reading far below grade level expectations. Students in yellow are reading below grade level expectations. Students in green are proficient for grade level reading expectations. Students in blue are reading above grade level expectations. I use data from this assessment to inform my initial guided reading groups, and I use formative data to adjust these groups as needed.
In a technological age that values data-driven decision making, using the mClass assessment makes it possible for me to track my students' TRC level. It gives me specific individual student data that I can use to target reading deficiencies through individual lessons or guided reading time. It also provides me with entire classroom data and progress monitoring data to tailor instruction to all students needs. The mClass assessment provides a variety of data tracking and analysis resources that are incredibly beneficial in my classroom. Additionally, this data is stored in the system and gives educators access to student data for all the years that they have been assessed on the Amplify system. I can see transfer student data and access their assessment data from their previous school and use the information to help inform my teaching. Expectations for reading instruction in kindergarten have drastically increased in recent years. The mClass assessment makes it easy for me to regularly collect and make use of assessment data to inform my classroom instruction. The assessment provides direction on how to plan target intervention for individual students. I would not be able to provide my students with the most relevant guidance for their reading deficiencies, without this hard data.
Example of a Complete Student Report and Teacher Analysis
This is an example of an individual student report for benchmark data in both DIBELS and TRC. In kindergarten, students are only tested on First Sound Fluency, Letter Naming Fluency, and Text Reading Comprehension during the BOY assessment. Phonemic Segmentation Fluency and Nonsense Word Fluency are tested during the MOY and EOY Assessment.

In this MOY Data report, you will notice that this student increased their score far beyond all assessment goals. Their ability to use phonemic awareness contributed to them receiving a "Blue" on DIBLES.
In their TRC data, this student grew three levels from BOY to MOY. This is above the standard rate of growth for TRC in kindergarten. They are now rated blue, an above grade level rating, on the kindergarten TRC assessment. This student needs only to make one level of growth to make the kindergarten standard for the EOY.

Individual Student Report with Benchmark data. This report displays differences in reading levels between the beginning of the year and middle of the year for one student.
Accessing TRC

This is a TRC Reading Running Record. I track students' reading on a tablet marking any mistakes during their assessment.

This is a TRC Reading Comprehension Tracker. I score students' reading comprehension on a scale of one to four.

This image displays the overall composite score given to students after they finish the TRC assessment. The score is comprised their accuracy and oral comprehension data.
TRC is used as a screening and progress monitoring measure for grades K-3. Text Reading and Comprehension assessment is an individually administered assessment using leveled books to determine a student’s instructional reading level. During this measure, students are asked to read a benchmark book and complete a number of follow-up tasks. As an assessor, I observe and record my students' oral reading behaviors through the administration of TRC to determine reading accuracy and fluency. While a student reads from the leveled text, I follow along on a computer, tapping with a stylus to record the student’s performance.
To the left, you will see a sample of a TRC reading assessment. I make notes of inaccuracies while tracking the reader. Orange marks represent words that are substituted for a different word. Red marks indicate scenarios where students were stuck and received guidance with the word. Green markings display words the student self-corrected. Blue marks reference words the reader omitted.
The students are asked to complete a number of follow-up tasks including Oral Comprehension and Retelling when the reading is finished. The comprehension components help me determine whether my student understands the meaning of the text which also helps calculate the student’s instructional reading level. I am provided with directions and prompts to ensure that each student is receiving a standardized and accurate assessment.
A student's instructional reading level is the highest level on which the student is able to read a text with an accuracy score above 90%. The TRC takes the accuracy rate and an oral comprehension score from one to four to create a combined assessment value.
In the TRC data to the left, you can see that this student's new instruction level is D because they received a passing score of 94% accuracy and three out of four on the oral comprehension component.
I take special note of the MSV analysis on the right of the data. MSV stands for meaning, syntax, and visual mistakes. This analysis helps me better understand each student's instructional needs and helps provide students with specific support.
Student Growth: Reading Level and Fluency
BOY represents the Beginning of the Year TRC Data.
MOY represents the Middle of the Year TRC Data.
EOY represents the End of the Year TRC Data.
The data summary to the left shows my students' progress throughout the 2016-2017 school year. Their progress is evident by viewing the BOY, MOY, and EOY columns in the year-long student assessment document on the left. Rows in the document represent individual student identities. The intersection of rows and columns indicate a student's grade at that time of the year. This summary provides holistic TRC assessment information gathered from my students throughout the year. Forty percent of the class ended the school year above TRC grade level standards.
My students were able to make these large gains because I set individual instructional goals and evaluated individual student progress throughout the year using the TRC progress monitoring. Students became empowered to set goals for themselves that were meaningful, ambitious, and attainable for the entry level of their initial skill.
By conducting progress monitoring throughout the year I was able to evaluate each student's progress compared to other students with similar initial skills. This helped me examine their current status, specify unique improvement areas, and evaluate whether they were making adequate progress. It was simple for me to adjust instructional times to fit the needs of each student during guided reading and one-on-one reading time.
This Column represents the last data that each student was progressed monitored on TRC.

Pie Chart of Beginning of Year Reading 3D Scores. Red indicates students reading far below grade level. Yellow indicates students reading below grade level. Green indicates students reading at a proficient reading level.

Beginning of the Year TRC Reading 3D Data
At the beginning of the 2016-2017 school year, 32% of my class tested as far below grade level according to the BOY TRC Reading 3D assessment. This means students were reading below PC. They were unable to identify letters, words, and punctuation.
Those performing below grade level account for 7% of my class at the beginning of the year. They tested at PC which means they were able to distinguish between letters and words, as well as, point out capital letters and punctuation.
The majority of my students, 61%, tested as proficient or on grade level. The criteria for grade level is the ability to use pictures to predict words, the ability to follow sentences from left to right, and the ability to identify sight words.
Middle of the Year TRC Reading 3D Data
The middle of the year TRC Reading 3D evaluation of my students showed an increase in the number of students testing above grade level. During the initial accessment, no students were categorized as above grade level. 17.8% of the students in my class were evaluated as above grade level following the TRC Reading 3D middle of the year assessment.
The number of students in my class testing far below grade level declined by 66% compared to the initial assessment.
Pie Chart of Middle of Year Reading 3D Scores. Red indicates students reading far below grade level. Yellow indicates students reading below grade level. Green indicates students reading at a proficient reading level. Blue indicates students reading above grade level.

End of the Year TRC Reading 3D Data
After the End of Year TRC Reading 3D assessment, the percentage of my students reading at far below or below grade level declined by 45.45% relative to the beginning of the year. Three percent of the class was evaluated at far below grade level. During the beginning of the year assessment, 32% of all students tested at this level. This significant decline is mirrored in the increase in students reading at grade level or above.
After the End of Year TRC Reading 3D assessment, 78.57% of the class was reading at proficient or above grade level. This represents an increase of 29.41% of students reading at proficient or above grade level from the initial assessment.
Pie Chart of End of Year Reading 3D Scores. Red indicates students reading far below grade level. Yellow indicates students reading below grade level. Green indicates students reading at a proficient reading level. Blue indicates students reading above grade level.

Personal spreadsheet created to track students growth throughout the year.
Years of Growth
Bar graph showing each students Years of Growth from their TRC mClass reading data.

The spreadsheet displayed above indicates the "years of growth" achieved for each student. A year of growth is defined as the advancement across four reading levels as defined by the mClass Reading 3D assessment. The spreadsheet also indicates factors beyond my control such as whether individuals were classified as IEP or transfer students. All students who were in my class for the entire school year made gains of at least one "year of growth". Over 89% of my students achieved one "year of growth" or higher. Fourteen students, representing half of my classroom, made between 1.25 -1.75 "years of growth" in their TRC reading level during the 2016-2017 school year.
Classroom Tracker
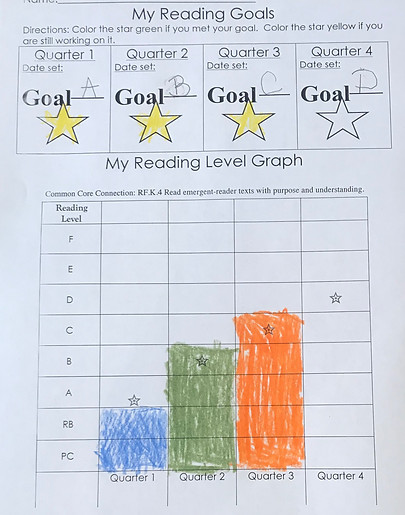
Student's Individual Reading Tracker
The quantitative data from the TRC mClass assessments is difficult for kindergarten students to interpret. My students create a personal reading goal chart and track their progress throughout the year. I also create a large classroom tracker for students to see our reading date in a more developmentally appropriate way.
To the left is an individual reading tracker which students keep in their guided reading notebooks. At the end of each quarter, the student's progress is monitored using TRC Reading 3D tools. Student track the gains they have made toward our big end of the year reading goal. They also have an opportunity to set their own goal if they want to surpass the classroom goal of reading level D by the end of the year.
In the classroom, I use big monster trackers to help motivate students to read at home and in school. Each student in my classroom is assigned a number. That number is what they can use to identify themselves in school on all of our data tracking tools throughout the classroom. During TRC reading assessment and progress monitoring, the students who move up a level get to "move" their monster. Students love seeing the monsters move from PC all the way past D by the EOY assessment.

Classroom Monster Reading Tracker created from quantitative TRC data
Using TRC to Inform Guided Reading

Guided Reading Grouping Chart
created by mClass. This chart shows the breakdown of how I should group my students depending on their reading deficiencies and needs.
To ensure my students consistently make dramatic academic growth, I use the TRC 3D Reading assessment to inform my decision making for guided reading groups and individual intervention plans. The platform automatically organizes students into groups depending on TRC and phonetic awareness. It also places students who are struggling with the same MSV reading errors into groups. This allows me to focus on the needs of each student while meeting with them during group time.
Each group is given reading lessons plans and books that will help push them to the next reading level. The reinforcement instruction on the left is for guided reading group six. This group was unable to move to the end reading level due to reading comprehension. I will teach a series of mini-lessons during our guided reading time that focuses on understanding the information they have read to help them make progress toward their reading level.
This targeted information and plans help propel my students to improve their TRC scores. You can see the Wind and Sun Character and Setting comprehension lesson plan here. I would use this lesson plan provided by mClass over a week of guided reading to improve my student ability to retell information about a text.

This is the suggested lesson plan for guided reading group six. These lesson plans are created by mClass and address the specific needs of the students in group six.
Conclusion
As a result of my progress monitoring, guided reading practice, intervention plans, and close attention to benchmark TRC data, my students have shown tremendous growth in their reading ability. When analyzing the quantitative data, I was impressed with how far my students progressed from the beginning of the year. Over 78% of my class was reading at proficient or above grade level at the end of the year. This represents an increase of 29.41% of students reading at proficient or above grade level from the initial assessment. The growth that they have achieved this year inspires me for their potential for the future. As a kindergarten teacher, I aim to create a strong foundation in literacy that will give my students the ability to read. This data proves that my students have developed the basic skills needed to become life-long learners.
References:
Amplify . (n.d.). Retrieved April 14, 2018, from https://www.amplify.com/
Reschly, A. (2010). Reading and school completion: Critical connections and Matthew effects. Reading and Writing Quarterly, 26, 67-90. doi:10.1880/105735609 03397023
Torgesen, J. (2004). Avoiding the devastating downward spiral: The evidence that early intervention prevents reading failure. American Educator, 28(3). Retrieved from http://www.aft.org/newspubs/periodicals/ae/fall2004/index.cfm